This summer’s research had three goals:
- to begun to understand the relationship and route between the ancient sites of Garni and Artashat;
- to train colleagues on GIS; and
- to test an entirely digital workflow that utilized open-source software and inexpensive hardware, in order to think through a system that would be sustainable for archaeologists of fewer resources.
This post will focus on #3, primarily because the work on 1 and 2 is ongoing. I made progress on each of goals 1 and 2, but there is still work to be done.
The third goal, a sustainable digital workflow, was important to me for a variety of reasons. First, as archaeology turns to productive and useful technology like LIDAR, drones, magnetometry, GPR, and even GIS like Esri’s ArcGIS, archaeology is becoming a discipline so expensive that organizations like the Institute of Archaeology and Ethnography in Yerevan really almost rely upon international collaboration to access such technologies. In addition, as scholars in the U.S. – like me – come to be employed in contingent positions or teaching positions with little research support, such expensive technologies are difficult for us to access, as well.
Open-source software is an excellent solution to at least some of the problems of lesser-resourced research institutions and people. I also have a firm belief in the importance of scientific communication and datasharing, and I think that the social scientific community ought to consider adopting the principles behind open-source software. In addition to the sustainability of open-source software, the digital aspect of the sustainable digital workflow is also important because of its potential for creating datasets capable of multivocal interpretation.
The good news is that I achieved goal 3, but like all workflows and scientific tools, there are trade-offs to consider.
The hardware:
- Samsung Galaxy Tab A (2016) Prices varied between $212 – $227 for the three that I purchased
- Dell Latitude 5300 (admittedly not an inexpensive computer, but not top of the line, and my colleagues used QGIS on a variety of laptops of various ages)
The apps and software:
I selected this suite of tools in order to engage in archaeological survey in Armenia, around the ancient site (and current city) of Garni, running a pilot project that started my work on goal #1 above. This workflow can be considered by anyone seeking to conduct survey where a positional accuracy of between 5-10 m is acceptable (Open Data Kit will tell you how many satellites it has reached and what the accuracy is). The tradeoff for this project, then, is its GPS accuracy: more expensive tablets (e.g. iPads) can improve accuracy, but as even Esri has acknowledged, smartphones and tablets are easily within a reasonable range for a variety of projects.
The challenge was to consider how to create transects, walk them, record on the tablets while walking, and then figure out how to import the data into a GIS and use it. The solution:
- create grids based on UTM coordinates in QGIS;
- export the grid to use in GPX Viewer while in the field;
- use Open Data Kit to record and upload data to my Google Drive;
- and then use a .csv file to import the data into QGIS for analysis.
I did consider using QField to walk the transects. However, for recording purposes, I found ODK more intuitive, and GPX Viewer made the grids and the tablet’s position more easily visible. So I used QField primarily as a backup: I uploaded my grids to QField on my tablet, but I rarely doublechecked QField while using GPX Viewer.
In more detail, let me break down the technologies.
1) First, the grids and QGIS. This tutorial breaks down the creation of a plot sample set, and the grid is basically the same (you just select grid instead of point). I set the minimum x and y values according to round UTM coordinates so that as our survey expanded, I could create more grids that lined up with the ones I had previously made. Based on previous survey work in Armenia, I set the transects 50 m apart, which created a grid that allowed us to walk N-S transects or W-E transects, depending on the landscape. As the tutorial mentions, I then exported the grid to GPX Viewer, and I also added the grids to QField as a backup in case something wasn’t working properly with GPX Viewer (a circumstance that never actually came to pass).
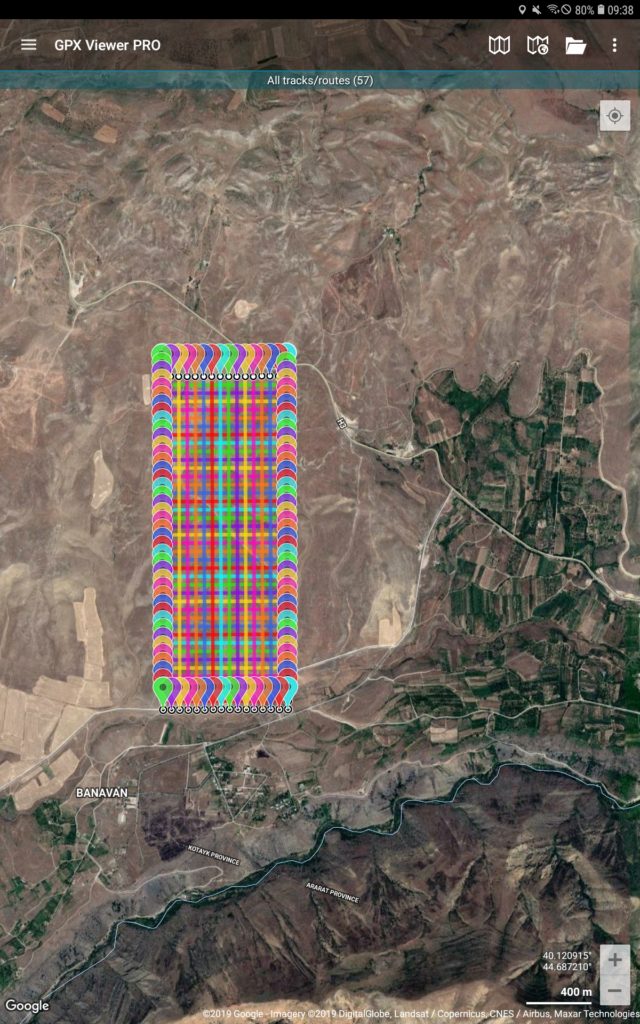 2) Next, importation to GPX Viewer. When you import the grid to GPX Viewer and open it, you see something like you see here. It looks busy from this zoom level, but since the lines are 50 m apart, while we walked, it was easy to keep track of where your line was. The multiple colors turned out to be an advantage that GPX Viewer had over QField – it was possible to tell one transect walker, you have blue, and stop at turquoise, while the other person walked yellow. The other advantage that GPX Viewer had over trying to walk lines in QField is that it was easier to see the blue dot indicating one’s own position; QField was just in general harder to work with to walk transects, especially in bright sunlight. Obviously, it has other advantages, but for transect-walking, GPX Viewer worked better for us. GPX Viewer is also of course free, but I did end up buying the GPX Viewer Pro for $5.50 for my (the lead’s) tablet, because it allowed me to record transects as I walked them. So if there was something off the grid that I wanted to explore more carefully, I could turn on the record function and keep track of what I had examined. I used that feature about once every other day, so it was nice to have but not absolutely necessary.
3) And next, data collection using Open Data Kit. Open Data Kit is an Android-based open-source free collector used by a variety of types of organization for field collection. Besides its status as open-source, I chose it because it works very well: it connects to Google Drive for storing your data, obviating the need for a server; and it has a GUI for creating the forms used on the mobile devices, so the learning curve is not terribly steep. The one thing it lacks is adequate documentation for connection to Google Drive, so I will try to outline the procedure below.
Since ODK does have good documentation for how to build a form, I won’t go into that here. Let’s start with a form you’ve created but need to link to Google Drive so that you can upload the data off the mobile device at the end of the day.
On your laptop:
- Create a new Google Sheet in Google Drive.
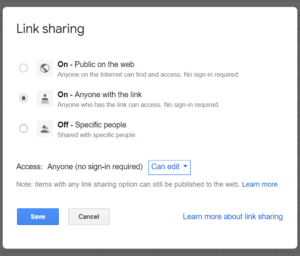
Sharing privileges on the Google Sheet
- Go to Share and make sure that “Anyone with the link” can edit the sheet, to ensure that your mobile device can in fact add data to the sheet. Copy the shareable link to your clipboard.
- In build.opendatakit.org, where you have already created your form, you need to go to Edit – Form Properties – and put the shareable link for your new spreadsheet in “Submission URL.”
On your mobile device:
- After you’ve opened ODK, you need to link it to your Google Drive.

ODK Form Properties
- Go to General Setttings (top right corner) and select Server.
- Input your Google Drive information.
Now, follow the directions from ODK for downloading a blank form, fill it out, and at the end of the day, when you send all the records, they should upload directly to your (originally totally blank) Google Sheet.
4) And finally, upload a .csv to QGIS.
The complication with ODK is that the GPS locations it provides are saved in the same column in your Google Sheet – i.e. a single column that says latitude, longitude. I found it easiest to use the following procedure to make sure that all the decimal degrees were saved (which I then changed into UTMs once in QGIS).
First, make a copy of your Google Sheet – do not change the document that ODK saves to. Doing so breaks the connection between the form on your mobile device and the Google Sheet. You need to make a copy so that you can change the x, y coordinates.
Next, insert a column to the right of the x, y coordinates.
Highlight both columns (x,y and your new column) and go to Format – Number – Plain Text. The reason for this is that Google (and Excel, for that matter) will otherwise round your #s, and you want all the available information. Plain Text means all values will be saved and not rounded.
And finally, go to Data – Split Text to Columns, and Google Sheets automatically disambiguates the x, y coordinates for you.
Now, take the disambiguated file and export it as a .csv, and you are now able to import it into QGIS, where you can manipulate it, change the decimal degrees to UTMs, etc.
____
And that’s it. Obviously, this is not the only way to record data in the field and use it in a GIS, but it is now a field-tested, open-source, reasonably-priced method for archaeological survey.